How to make Gantt chart for project management
Regardless of the kind of work you do, whether it’s building homes or writing software, you’ve certainly faced the challenge of managing projects on time and on budget.
While there are lots of tools that help you make projects happen, from todo lists to calendar-style apps to more complex software, there’s only one kind of a chart that incorporates everything you need to know about your project at once — a Gantt chart.
What is a Gantt chart?
At first glance, Gantt charts are simple — a number of linked bars demonstrating a timeframe.
Task A will run from Monday to Wednesday, task B from Tuesday to Wednesday, and task C from Wednesday to Friday — all of which come together to hit the final deadline of Friday when everything should be finished. Easy, right?
Gantt charts are essential to project planning exactly because they make tasks simple and visual, especially when there are multiple people working on the same project at once.
In any project, nearly all tasks have logical relationships: some tasks affect others. In project-management speak, these are called dependencies, and that’s exactly what Gantt charts are so good at displaying to keep everyone on the same page. There are generally four kind of dependencies to look out for:
- Start to start: The successor can’t begin until the predecessor has begun
- Start to finish: The predecessor can’t finish until the successor has begun
- Finish to start: The successor can’t begin until the predecessor has finished
- Finish to finish: The successor can’t finish until the predecessor has finished
Dependencies let us demonstrate where exactly the project has gone off the rails or what exactly you should expect to be doing in a few weeks’ time. This allows project managers and everyone else involved to adjust accordingly as the project progresses.
Key features in every Gantt chart
Gantt charts are primarily attractive because of their simplicity. They are essentially just horizontal bars that indicate the length of time for each task (with deadlines) and demonstrate any expected overlaps. There are three key features in every Gantt chart:
- Labels, which are arranged on every bar to specify what needs to be done
- Dates, which help monitor all deadlines
- Current time, which is represented as a single intersecting vertical line and gives a visual cue for how much of the project has been completed and how much is left
Pros and cons of Gantt charts
While Gantt projects are becoming more popular due to their visual simplicity, they are not absolutely perfect for every type of work. Here’s a quick summary of all the significant pros and cons to help you decide whether you need to use a Gantt chart maker for your next project.
Gantt chart pros:
- Gantt charts are easy to monitor and give you an instant idea of how your project is doing
- When you use Gantt chart software, you can change any input and see how it affects your whole project right away
- Overcommitments, duplicate tasks, and timeline issues are easily discovered
Gantt chart cons:
- It’s hard to wrap your head around a large Gantt project with hundreds of dependencies to analyze it properly
- If your Gantt chart maker doesn’t support automatically adjusting dependencies, every change to the timeline is going to take a long time to manage
- In case you miss to correct any part of the Gantt chart, the whole project quickly becomes unreliable
As you can see, Gantt charts work best for small to medium size projects with a handful of team members rather than for complex undertakings that require hundreds of people. So if you’re now thinking of trying out Gantt-style project management, which Gantt chart maker should you use?
The Best Gantt Chart Software Today
Good news is that starting with Gantt charts today is not difficult at all. There are a variety of high-quality apps that will help you create and maintain your project with little to no effort from your part. In terms of must-have features, you should be looking at the ability to assign tasks to various team members, set deadlines, use templates, and automatically move the schedule around if one of the inputs has to be changed. That said, here are the best Gantt chart makers right now.
How to make a Gantt chart in Excel
Chances are you probably subscribe to Microsoft Office 365 or have an installed version of Excel on your Mac. Such ubiquity is what often makes Excel the first choice when people go hunting for Gantt chart software. Plus, it’s a tool you don’t have to learn about from scratch.
In reality Excel is not a Gantt chart maker, but it’s flexible enough that you can turn it into one. While creating a Gantt chart in an empty Excel spreadsheet would be too time-consuming and laborious, you can choose an agile Gantt chart template that already includes most of the Gantt formulas to make your life easier.
Here’s how to use a Gantt chart in Excel:
- Choose agile Gantt chart from preconfigured templates
- Adjust milestone description, category, team member, progress, start date, and number of days required on the left side to see the changes be automatically reflected on the right. You can also change goals, milestones, and risk factors.
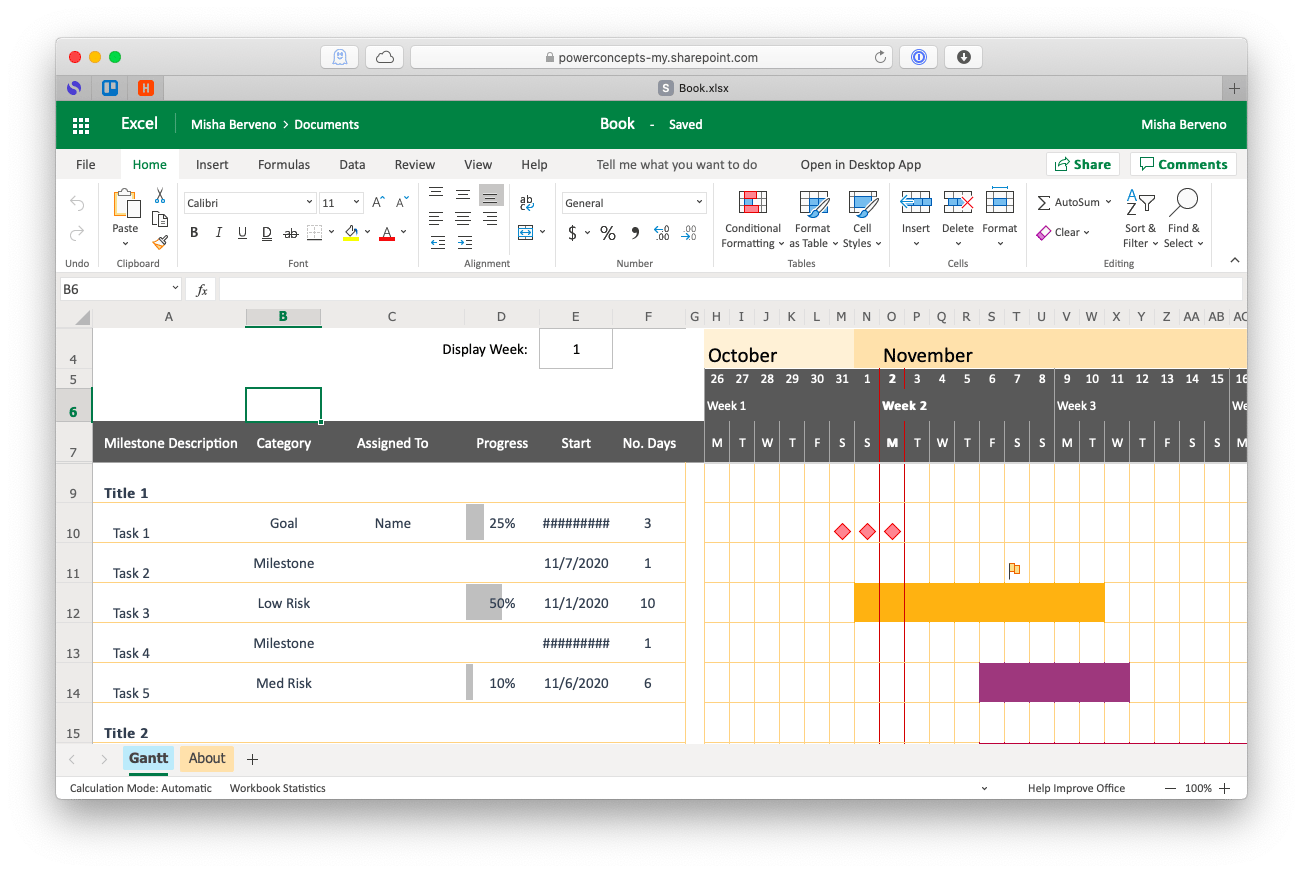
Since most people know how to use Excel, adjusting a simple occasional Gantt chart there will probably work fine. However, you can’t really see any warnings about schedule conflicts, for example, so once your project becomes a bit complex, you’ll be better off switching to actual Gantt chart software.
How to create Gantt charts with Numbers
If you use Mac software and rely on Apple Numbers more than Microsoft Excel, you can also tweak it to create simple Gantt charts for personal or small team projects.
Sadly, Numbers doesn’t provide a Gantt chart template in its presets. But instead of spending hours creating one, you can find a few different kinds online and adjust them as needed. You can even use an Excel one, since Numbers can read .xlsx files. Whichever template you choose, make sure it’s based on formulas, so you can easily change inputs on the left (just like in Excel) and automatically get proper output on the right, without tweaking things manually.
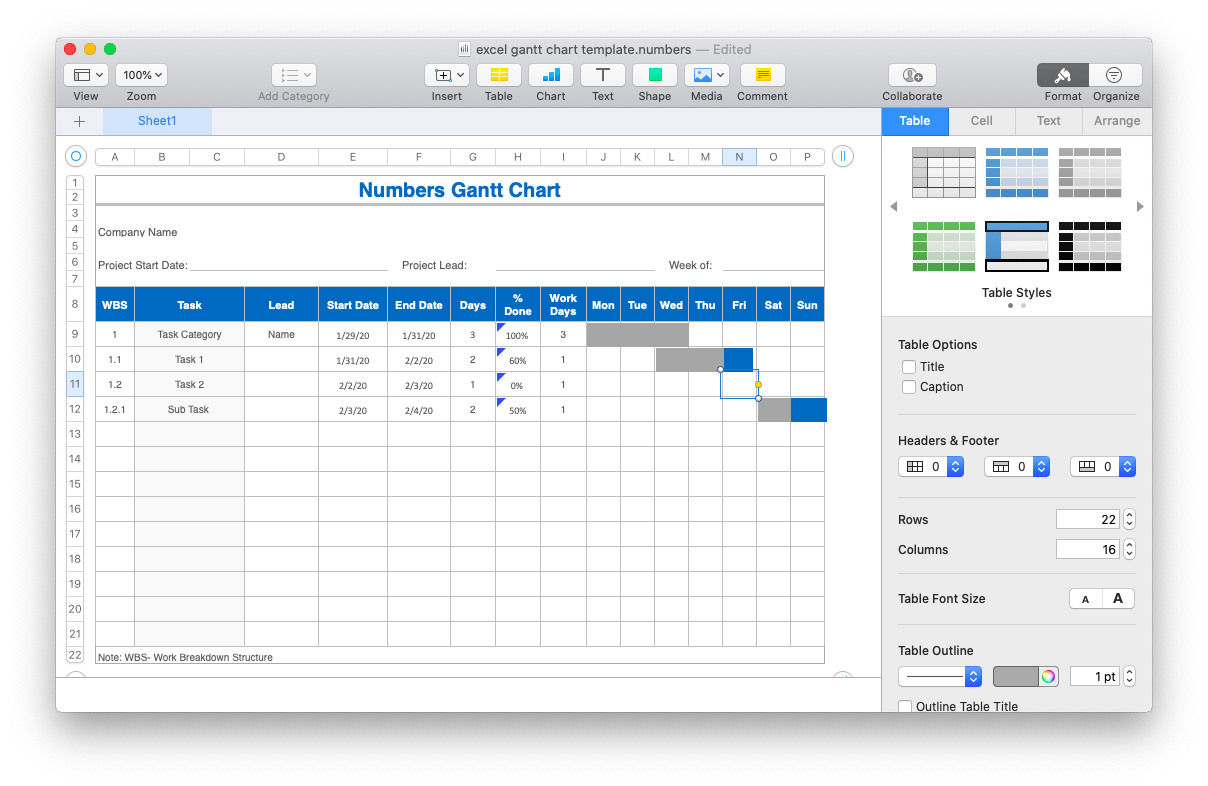
Similarly to Excel though, Numbers fares fine on small projects but would be difficult to maintain even with a few extra people doing a dozen or so tasks simultaneously. The advice is, again, to actually jump to proper Gantt chart software.
Manage Gantt charts with Merlin Project Express
When it comes to actual Gantt chart software, Merlin Project Express is one of the most intuitive ones you can find — perfect for your first Gantt project. Here’s how to use it:
- Simply open Merlin Project Express to start a new Gantt chart, either from scratch or by modifying an existing template
- Use a plus icon in the top-left corner to add tasks or goals to the project
- Arrange all tasks by numbers, specify their duration, and set deadlines. Create subtasks, if required.
- Make sure to fill out your project plan, available resources, and tags
- Assign your tasks to yourself and your team accordingly
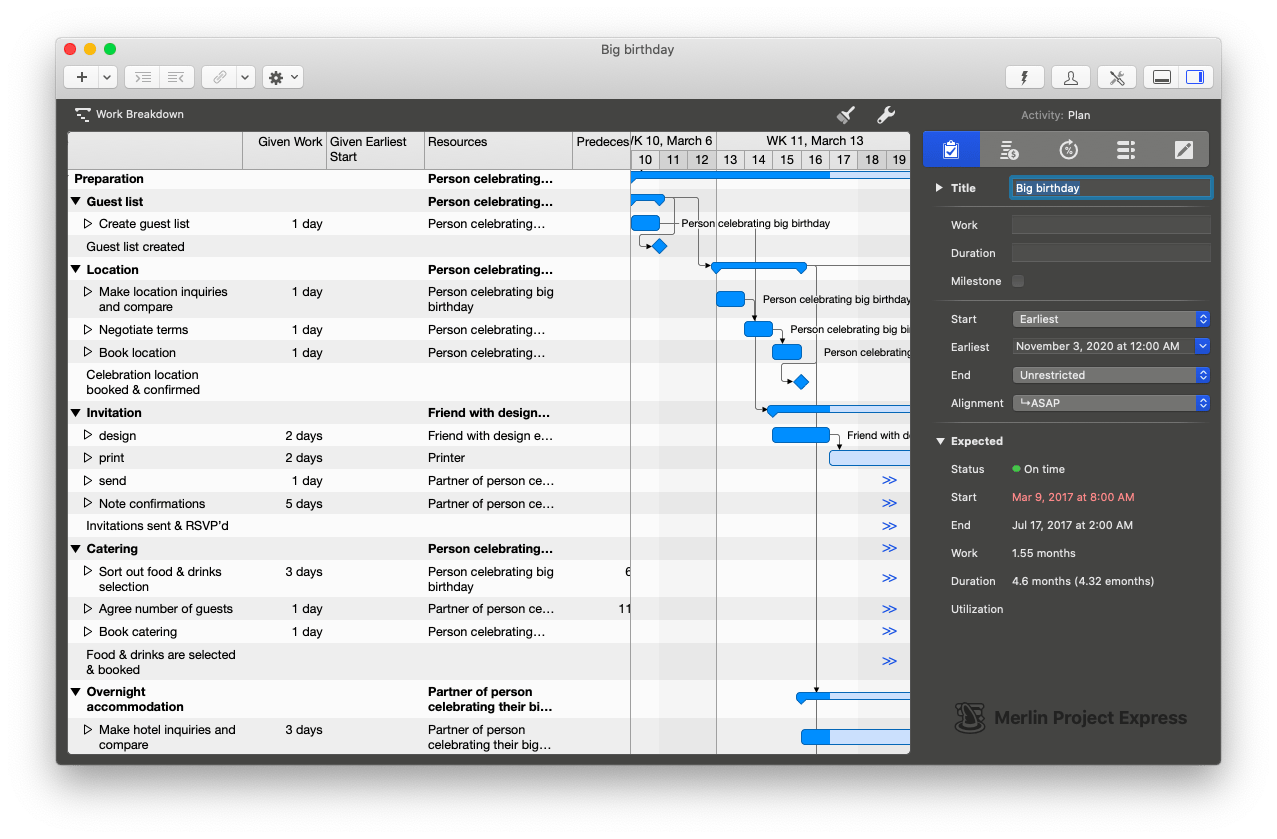
Merlin Project Express lets you track your projects easily, monitor available budget or resources, break down work into the smallest possible chunks, and attach any external resources to your tasks (e.g. emails, notes, images). You also don’t have to learn any Excel formulas, the app will do all the calculations for you.
Work with more Gantt charts in SheetPlanner
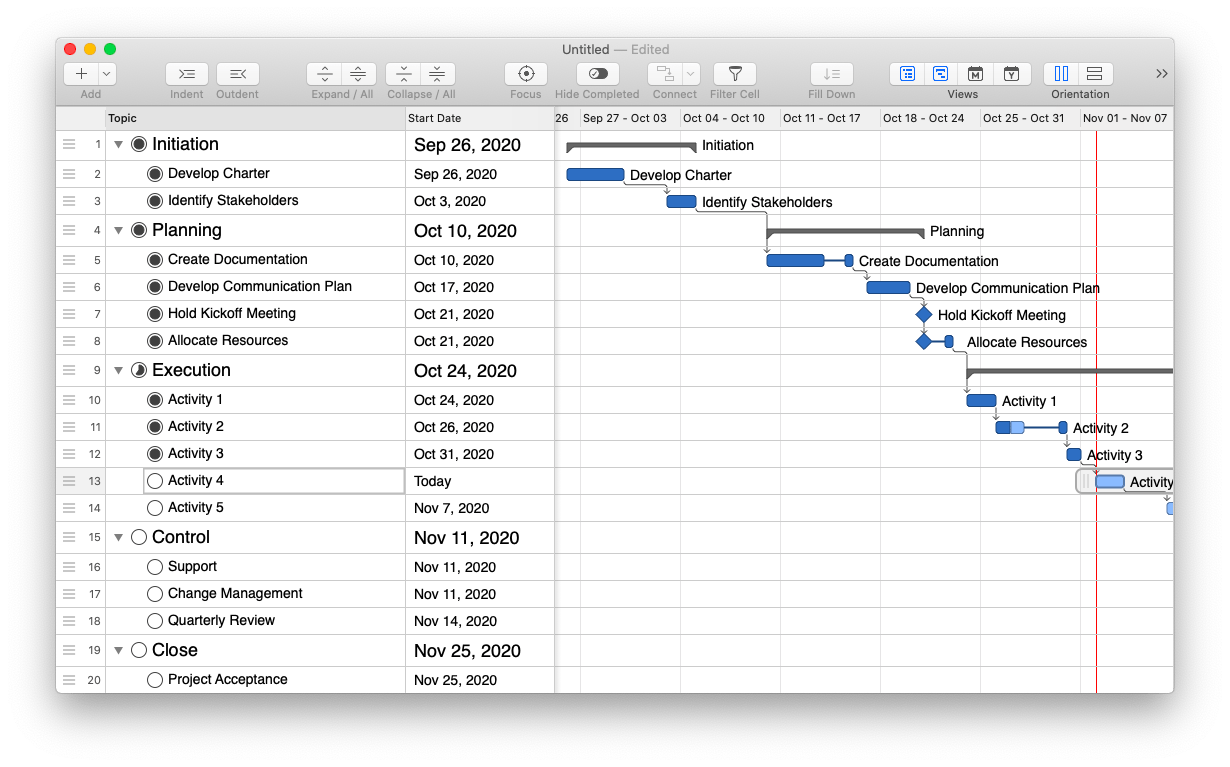
When one Gantt project isn’t enough, you might wish that your project management software had tabs, just like the ones in Excel. That’s exactly what SheetPlanner lets you do. Not only does this tool allow for multiple projects to be open at once, it also combines a task manager, calendar, and smart project organizer so you can tackle anything that needs to be done with ease.
Working on a Gantt project with SheetPlanner is a breeze:
- Open a Gantt chart template within the app
- Adjust any labels and deadlines
- Move things around as you need, and all the dependencies will change too. This is like Excel on steroids!
How Gantt projects will help you plan the future
It’s estimated that 37% of actively managed projects fail, with the number rising to 60% for IT projects. One of the top reasons for this is a “lack of clear roles and responsibilities.”
Gantt charts not only ensure that every task, including its timeframes, is accounted for but also assign them to individuals who can see the effect that not completing the task in time has on the rest of the project.
Best of all, Merlin Project Express and SheetPlanner are available to you absolutely free for seven days with a trial of Setapp, a platform with more than 200 top-rated Mac apps that would help you manage every aspect of your life. Try them all today at no cost and imagine how more productive your days can be.
