2026 Edition | The BEST diagram maker for Mac I found: Create an effective diagram for any occasion
My top picks for diagram makers for Mac are:
My colleague knew I was into Mac and iPhone apps, so she asked me for advice on a good diagram maker for her work project. Since I hadn’t really looked into this before, I decided to explore the topic myself — to see what makes a good diagram tool and how to create effective diagrams.
How to make an effective diagram?
Of the diagram creator apps, a few stand out.
First, be mindful of the type of diagram you’d like to create. Flowcharts and org charts are similar in structure, but communicate different information. Both are easily created using Diagrams for Mac.
Mind mapping is a different diagram type, and requires a bit more attention than most. MindNode Classic is an app focused entirely on the discipline of mind mapping, and has just about everything you need to create incredible mind maps quickly.
Diagrams: The easiest diagrams maker
Diagrams is a straightforward diagram creation app that relies on objects to frame the diagram. Once you’ve established your objects, simply dragging and dropping from one object to another helps create a relationship.
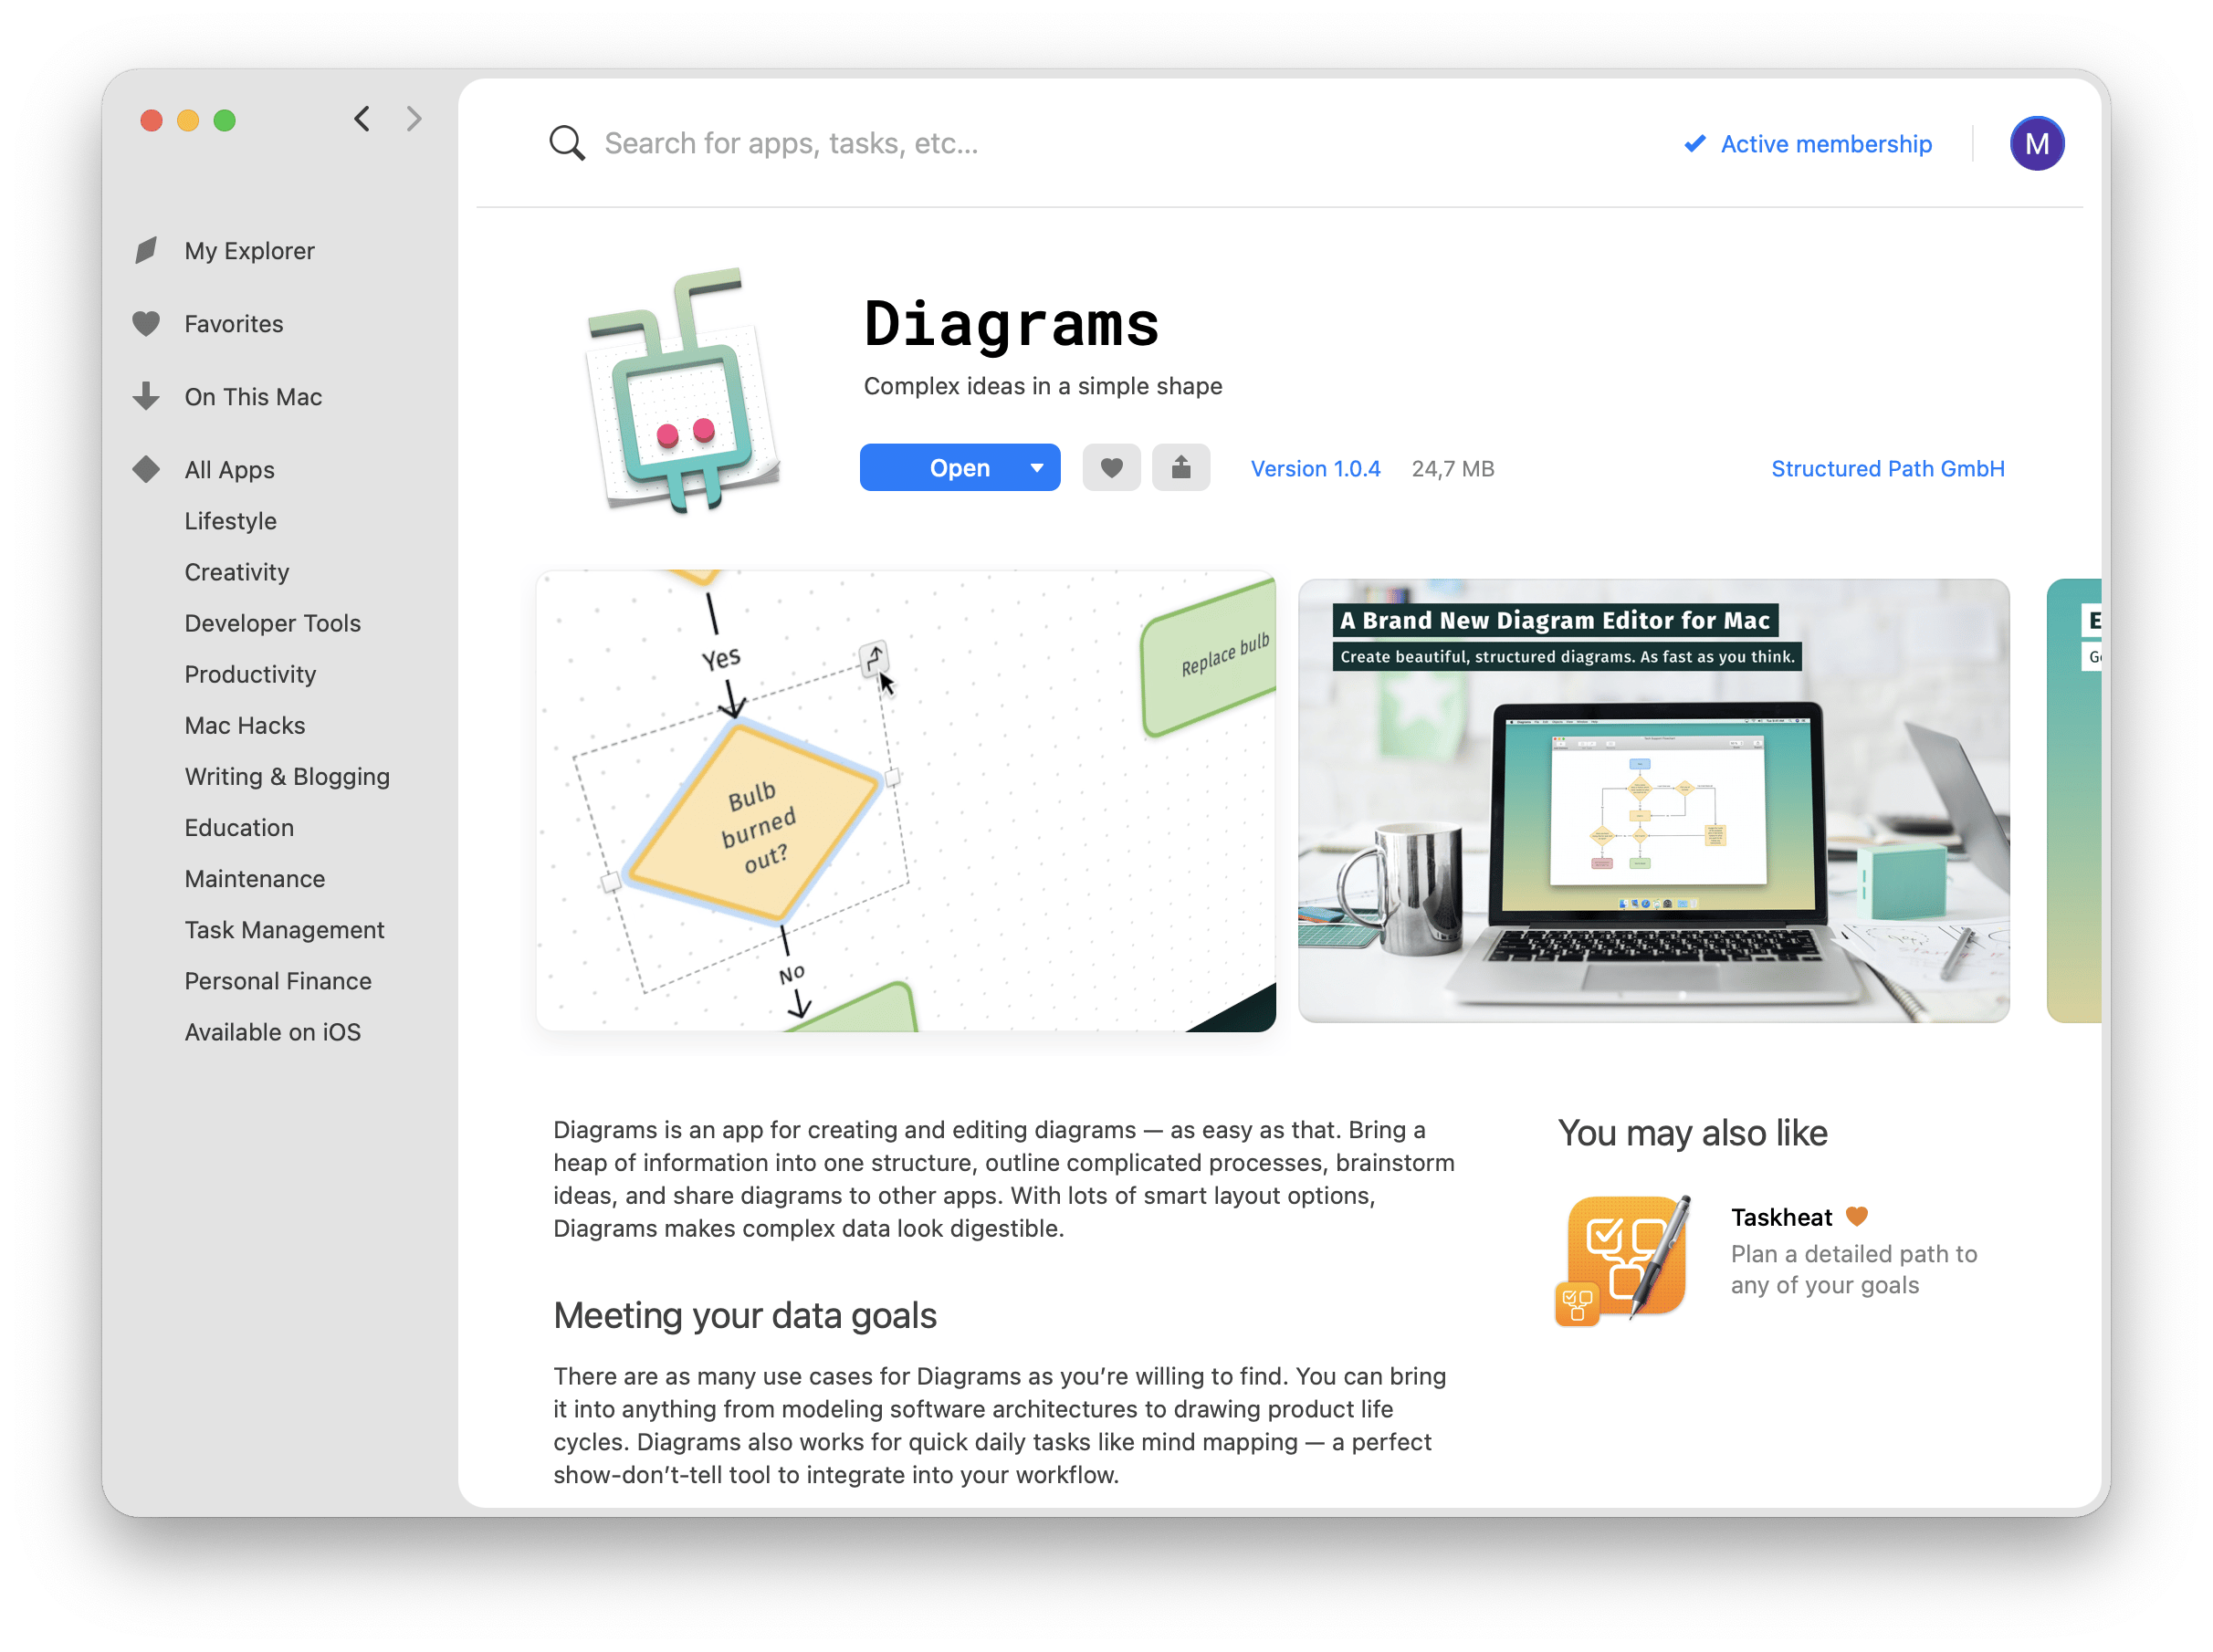
Objects in Diagrams can be one of four shapes and colors. Relationships can be more complex; you can choose solid lines, or one of several types of dotted lines. Arrows, double-arrows, and directional relationships are also available with Diagrams.
Getting started is simple. Open Diagrams on your Mac, select “add element” on the top menu to add your first object, and choose the shape and color of that object. Repeat those steps to add a second object.
Once you’ve got two objects, you can hover over one to bring up a line icon on the top right of the object. Select it, and drag onto the second object you want the object related to.
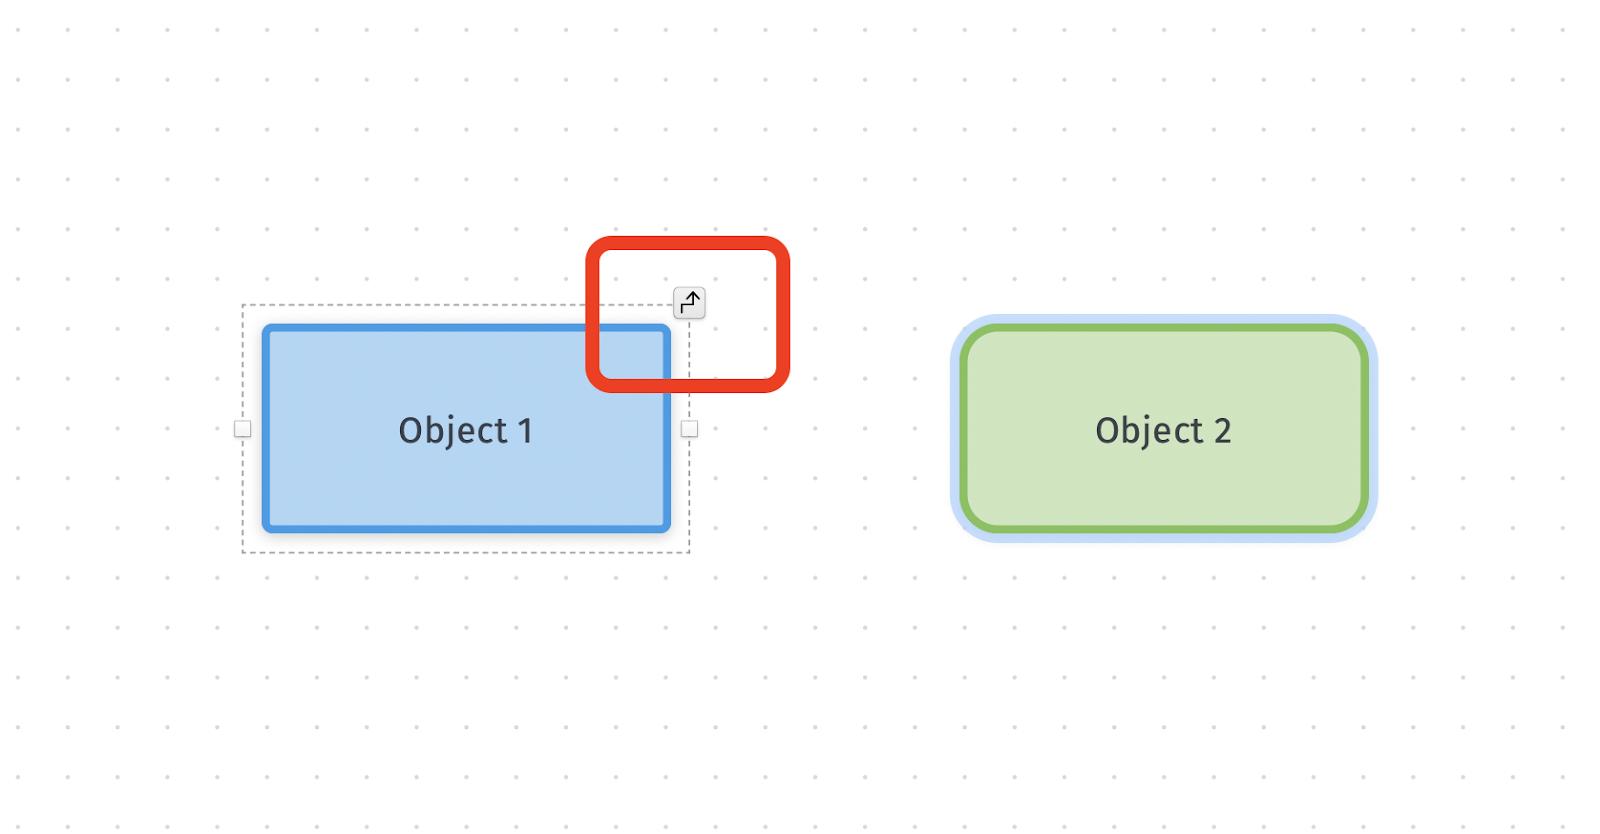
Once you’ve created the relationship, a menu showing the types of relationships you can add to your diagram will appear.
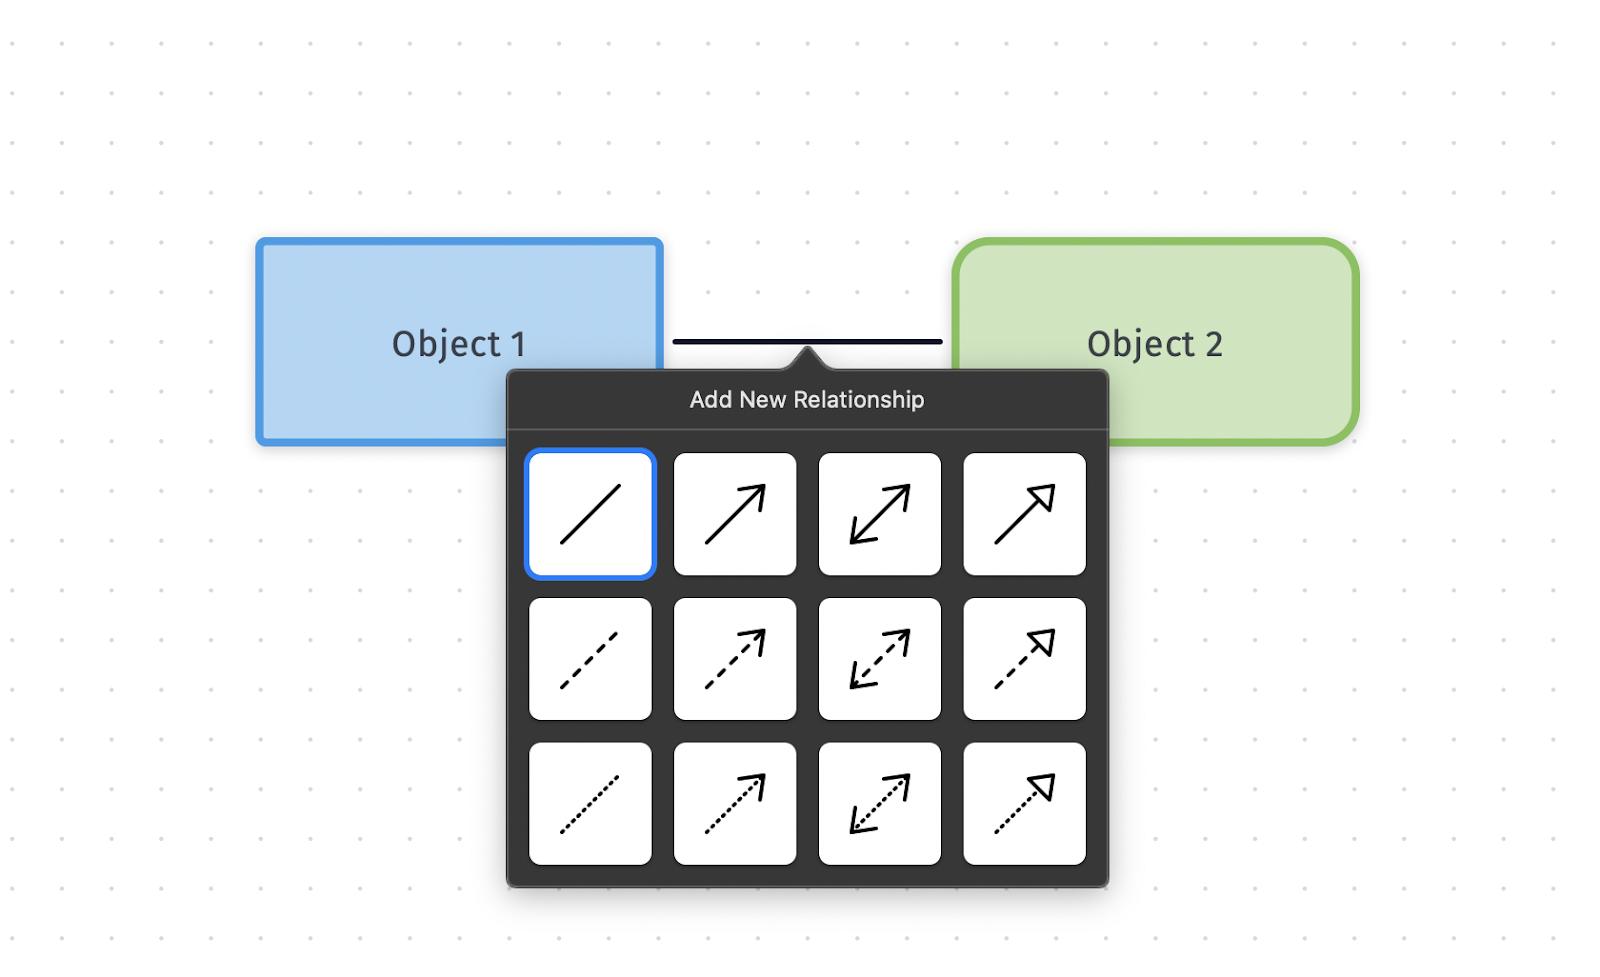
Simply add objects and create relationships until your diagram is complete. Diagrams is excellent for creating flowcharts and org charts.
Pros:
- A large range of text formatting and styling options to customize your project
- Diagram support for flow. It includes features like a grid and an infinite canvas
- It’s beginner-friendly
Cons:
- Limited advanced customization
Price:
Included in Setapp for a flat monthly fee, along with 250+ other apps
MindNode Classic: Powerful chart, visual canvas, and diagram maker
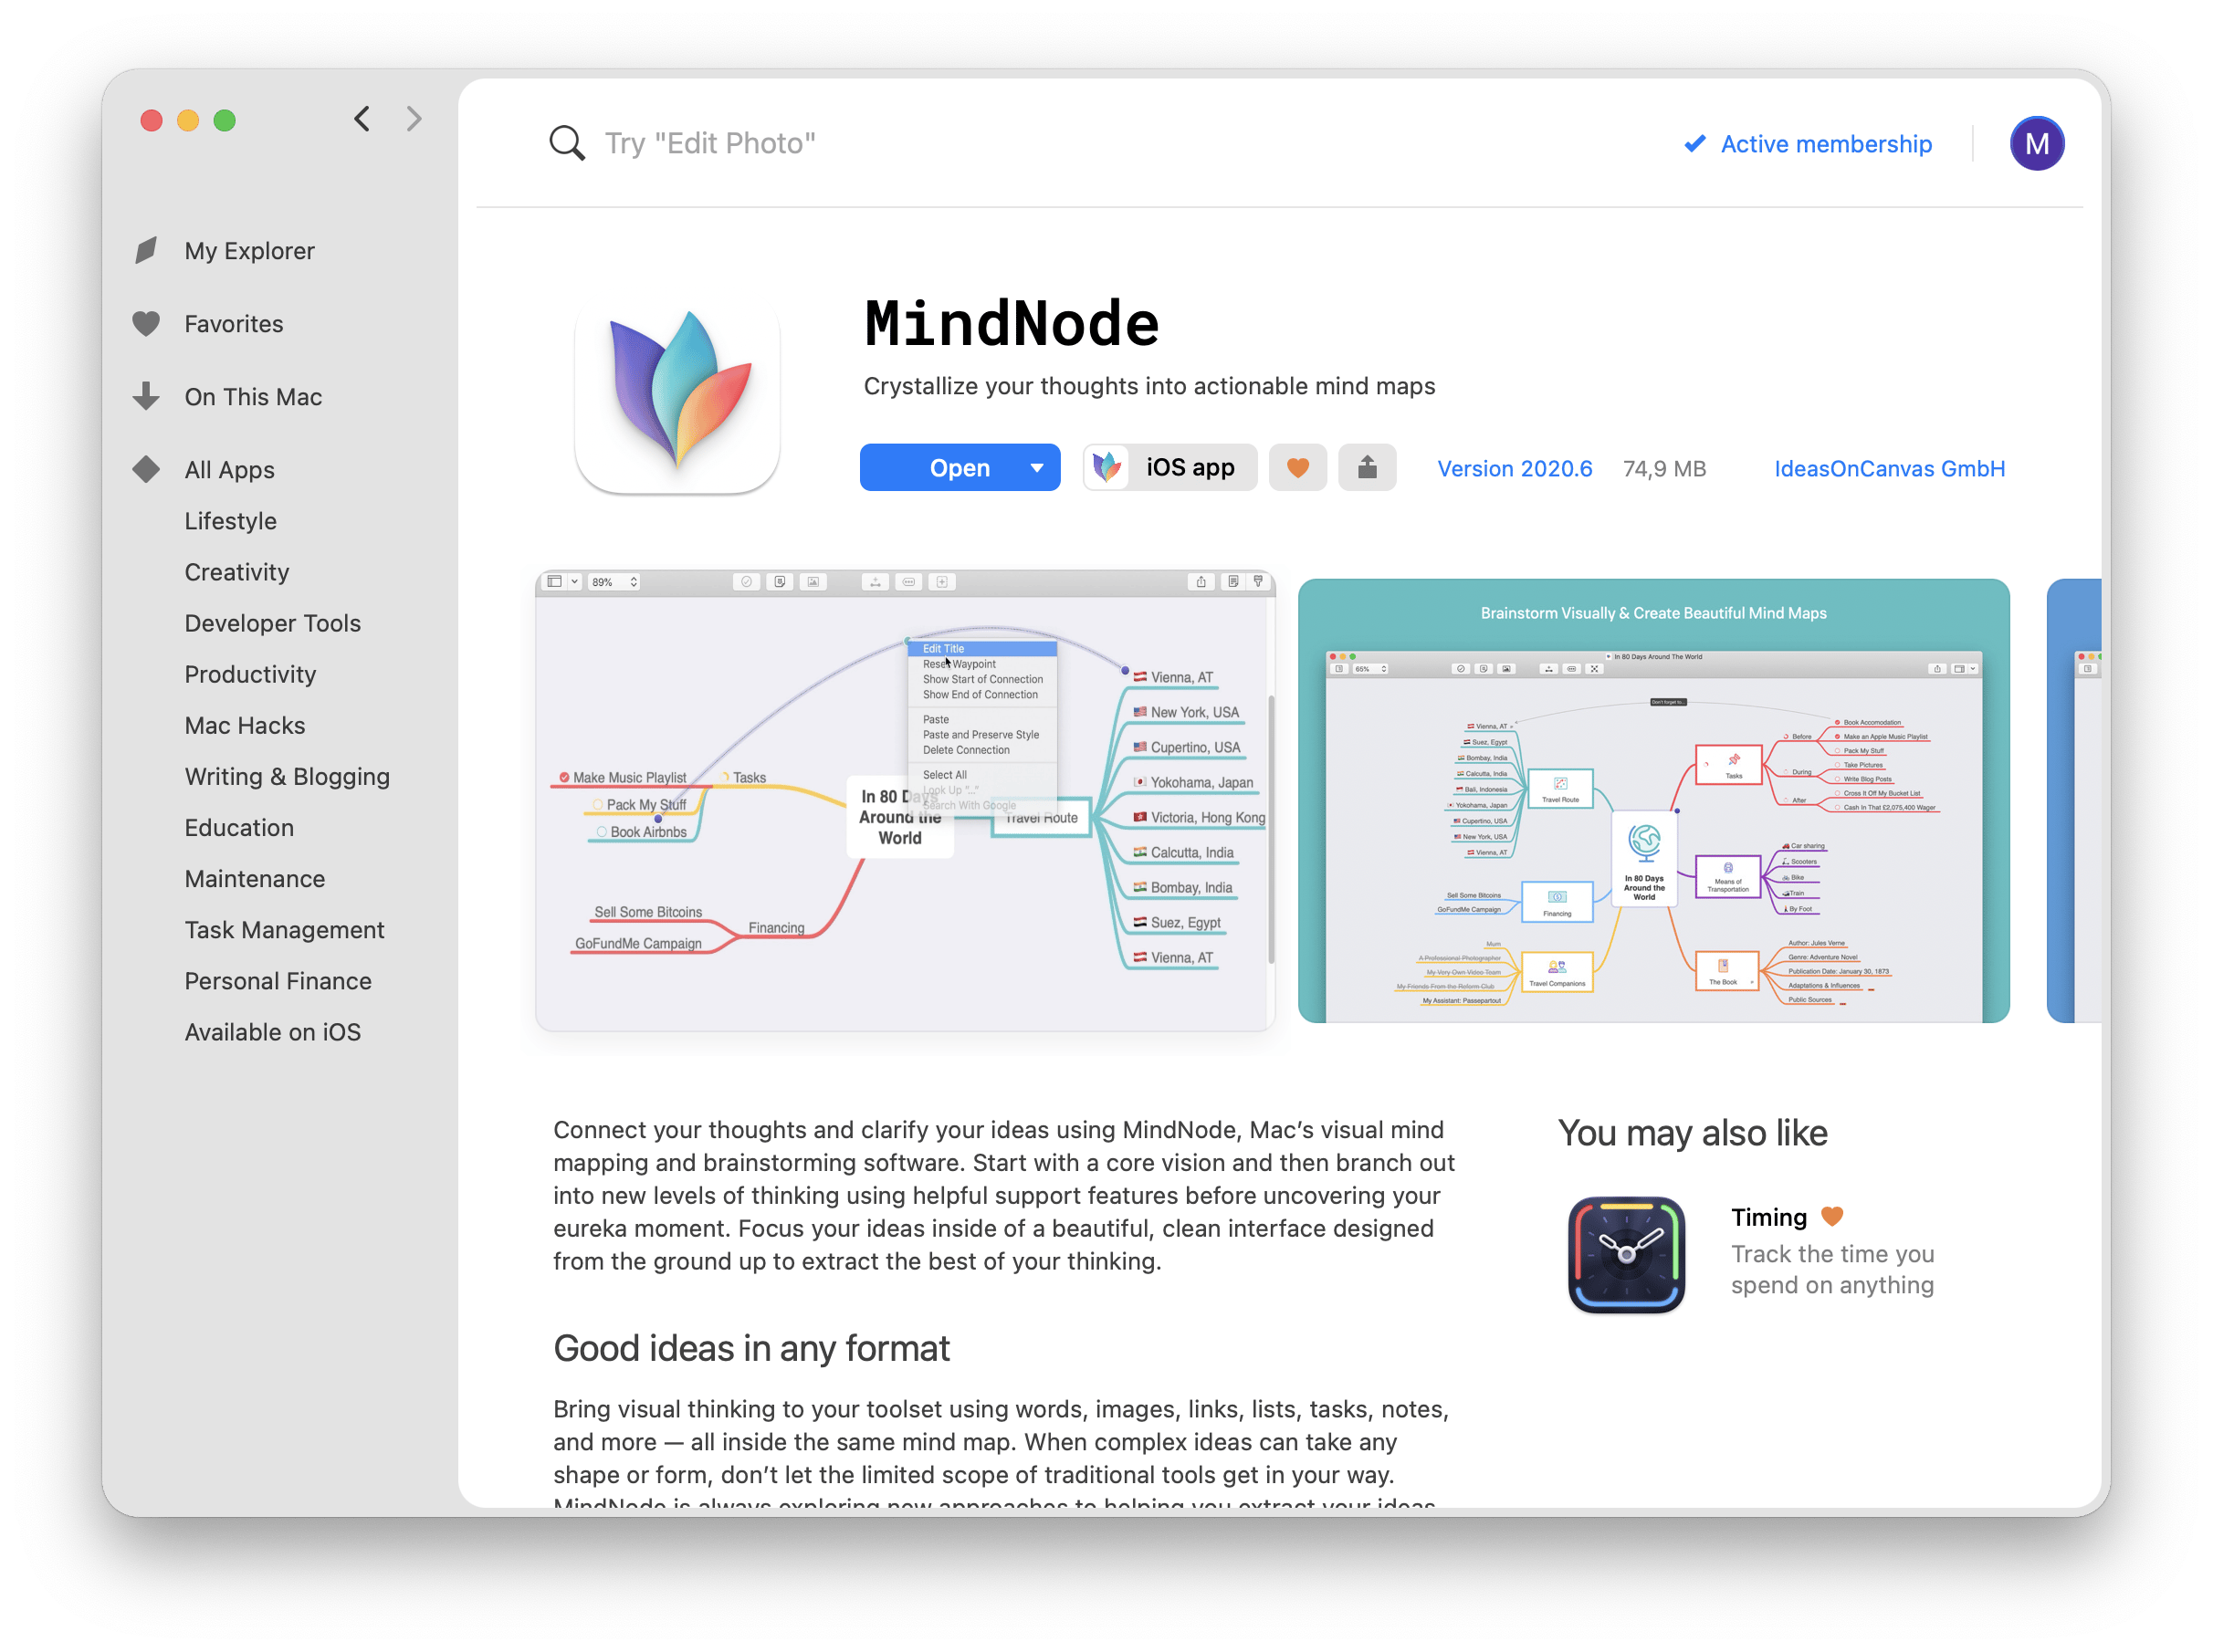
MindNode Classic leans into what it calls ‘main’ nodes as starting points. Each main node is its own rectangular icon in your diagram. Once you've established the important main nodes, you can hover over them to surface a 'plus' icon to add 'children.'
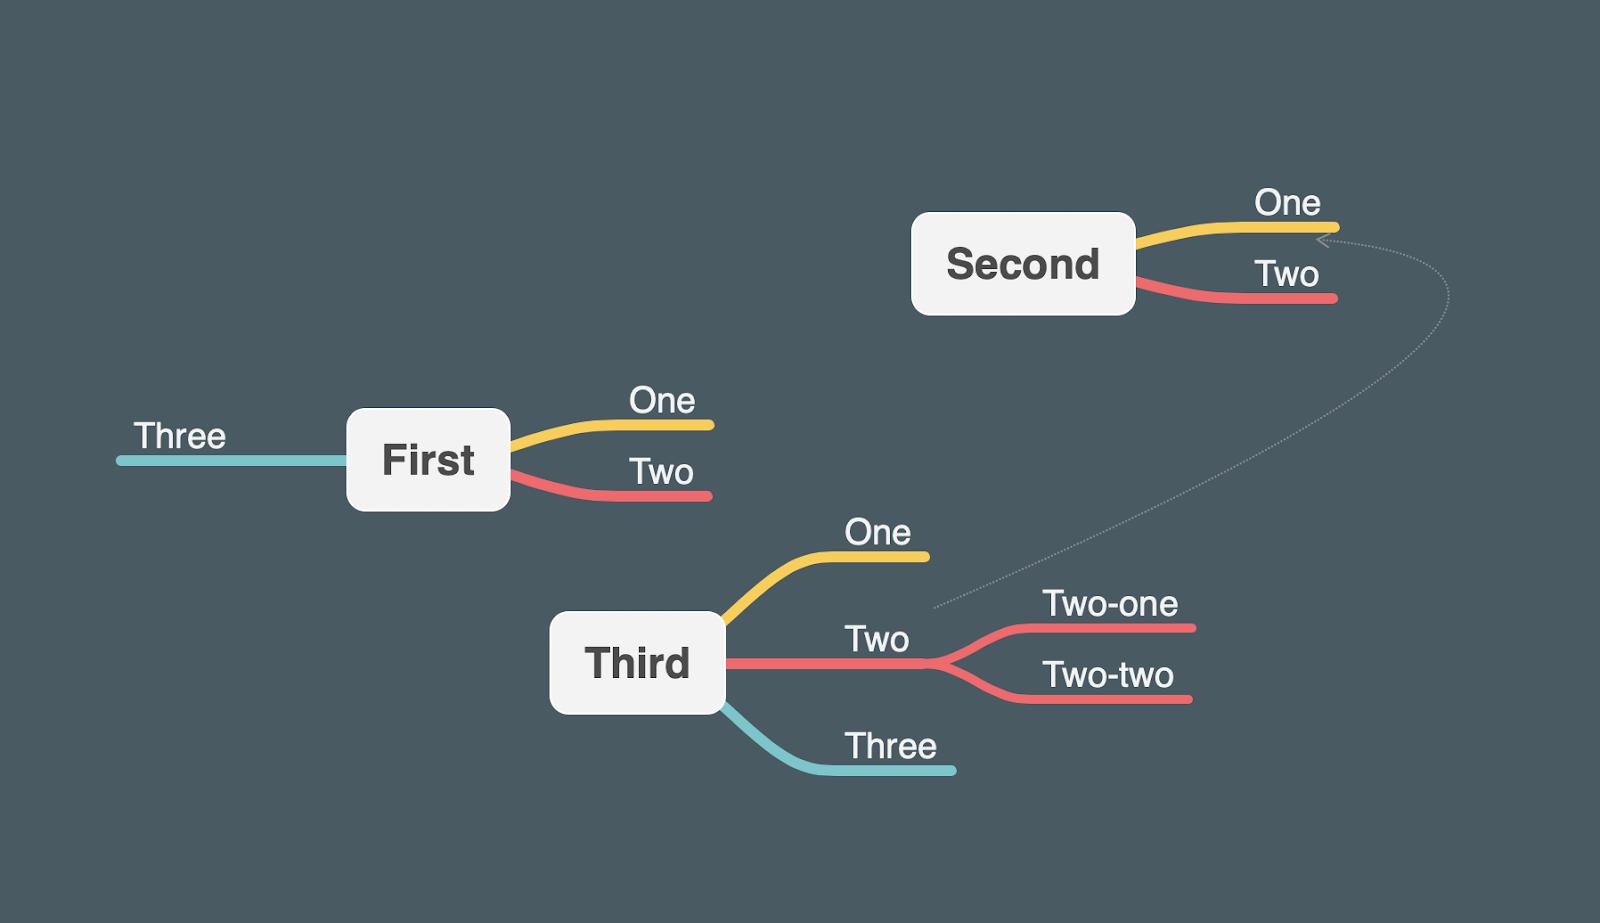
Children in mind mapping are like sub-topics of the main node, or ‘parent’ node. Each of those child nodes can have their own unique children. This concept of children as sub-topics can be as expanive as you like.
MindNode insists on both the plus icon and right-clicking the screen to create new objects and children, which is very familiar and allows for quick creation of objects. You can add notes to any node or child, too, a great way to log more data into a chart without bogging it down with line-items associated with an object.
Each node or child can have relationships to other nodes or children, too. As you can see below, two of the children have a relationship, though they are each associated with different nodes.
Mind mapping has pros and cons you should be aware of. Though it’s a great method for displaying and communicating large sets of data and helping people understand relationships and responsibilities of a team, mind maps can get a bit unruly if you’re not careful. It’s easy to get caught up with creating incredible mind maps without considering how it may present to others.
You may find them useful for personal use as well, though the same issue exists. Dumping your thoughts into MindNode can be useful, but remember mind maps are meant to be referenced. A diagram with too much data is not useful if it’s not clear and concise.
Similarly, a flow chart may not convey all the necessary data in the right way. Mind maps and flowcharts have very different use cases, and are not interchangeable. Consider which type is best for your needs, and limit the volume of data in each.
Extra tipWhen creating diagrams, you can improve your workflow by using other apps alongside your diagramming tools. Here are some apps available on Setapp that you can use for note-taking, editing visuals, etc. to support your diagram creation:
|
Common diagram types
The most common diagram types are popular for a reason: they are useful in more circumstances. Here are some popular diagram types.
- Flowchart: The flowchart shows processes and relationships in a linear top-down visualization. These diagrams pack a lot of info in a tight frame; you can show the flow of a process or information, and troubleshoot. Often, flowcharts show binary yes and no options for simple questions, where a correct answer continues the path toward the end goal. If the wrong answer is provided at the given step, the user is directed to return to another object in the diagram.
- Mind maps: Mind mapping is another excellent diagramming format. These help you communicate complex data in an easy to read format, relying on core objects as focal points. Each object has branches, which illustrate additional information or responsibilities of the main object. Objects drive mind maps, but it’s best to limit a diagram to a few core objects. Because those objects can become complex as you add branches of additional data, they can become cluttered. Mind maps are really helpful for displaying how teams at a company work together, too.
- Org charts: The organization chart is used to show the hierarchy in a company, including who reports to which leadership team, and their direct manager. It’s another helpful tool for conveying often complex structures to those new to a company, or when the company undergoes a reorganization and those directly unaffected have a new leadership structure above them.
Final thoughts on diagram makers
For most, flowcharts and mind maps will be the only two chart types needed. These two diagram types make communicating complex data simple, even if they’re for personal use.
Diagrams and MindNode Classic are two of the best apps available for either chart type, and it’s worth having both in your arsenal of apps. I really like the ease of use for both apps, particularly Diagram’s simple in-app menu that gets you up and running with flowcharts or org charts in a matter of seconds. Many other apps ask that you learn a complex system of buttons and settings; Diagram gets you started creating right away.
MindNode does a stellar job of helping you create effective mind maps. Some apps dedicated to this chart type offer confusing interfaces and ask that you jump through hoops to create a diagram. MindNode relies on very simple icons and the familiar right-click to surface everything you need. Like Diagrams, its simple in-app menu is reserved for dedicated functionality (in the case of MindNode, adding icons, images, and relationships).
Both apps are available for free during a seven day trial of Setapp, the world’s best suite of productivity apps for your Mac. Along Diagrams and MindNode, you’ll get immediate access to the entire Setapp catalog of nearly 250 excellent Mac apps, all for free!
When your trial ends, Setapp charges a flat monthly fee for continued unlimited access to the full suite of apps, so why hesitate any longer? Give Setapp a try now!

